
Quick Start
Dashboard Overview
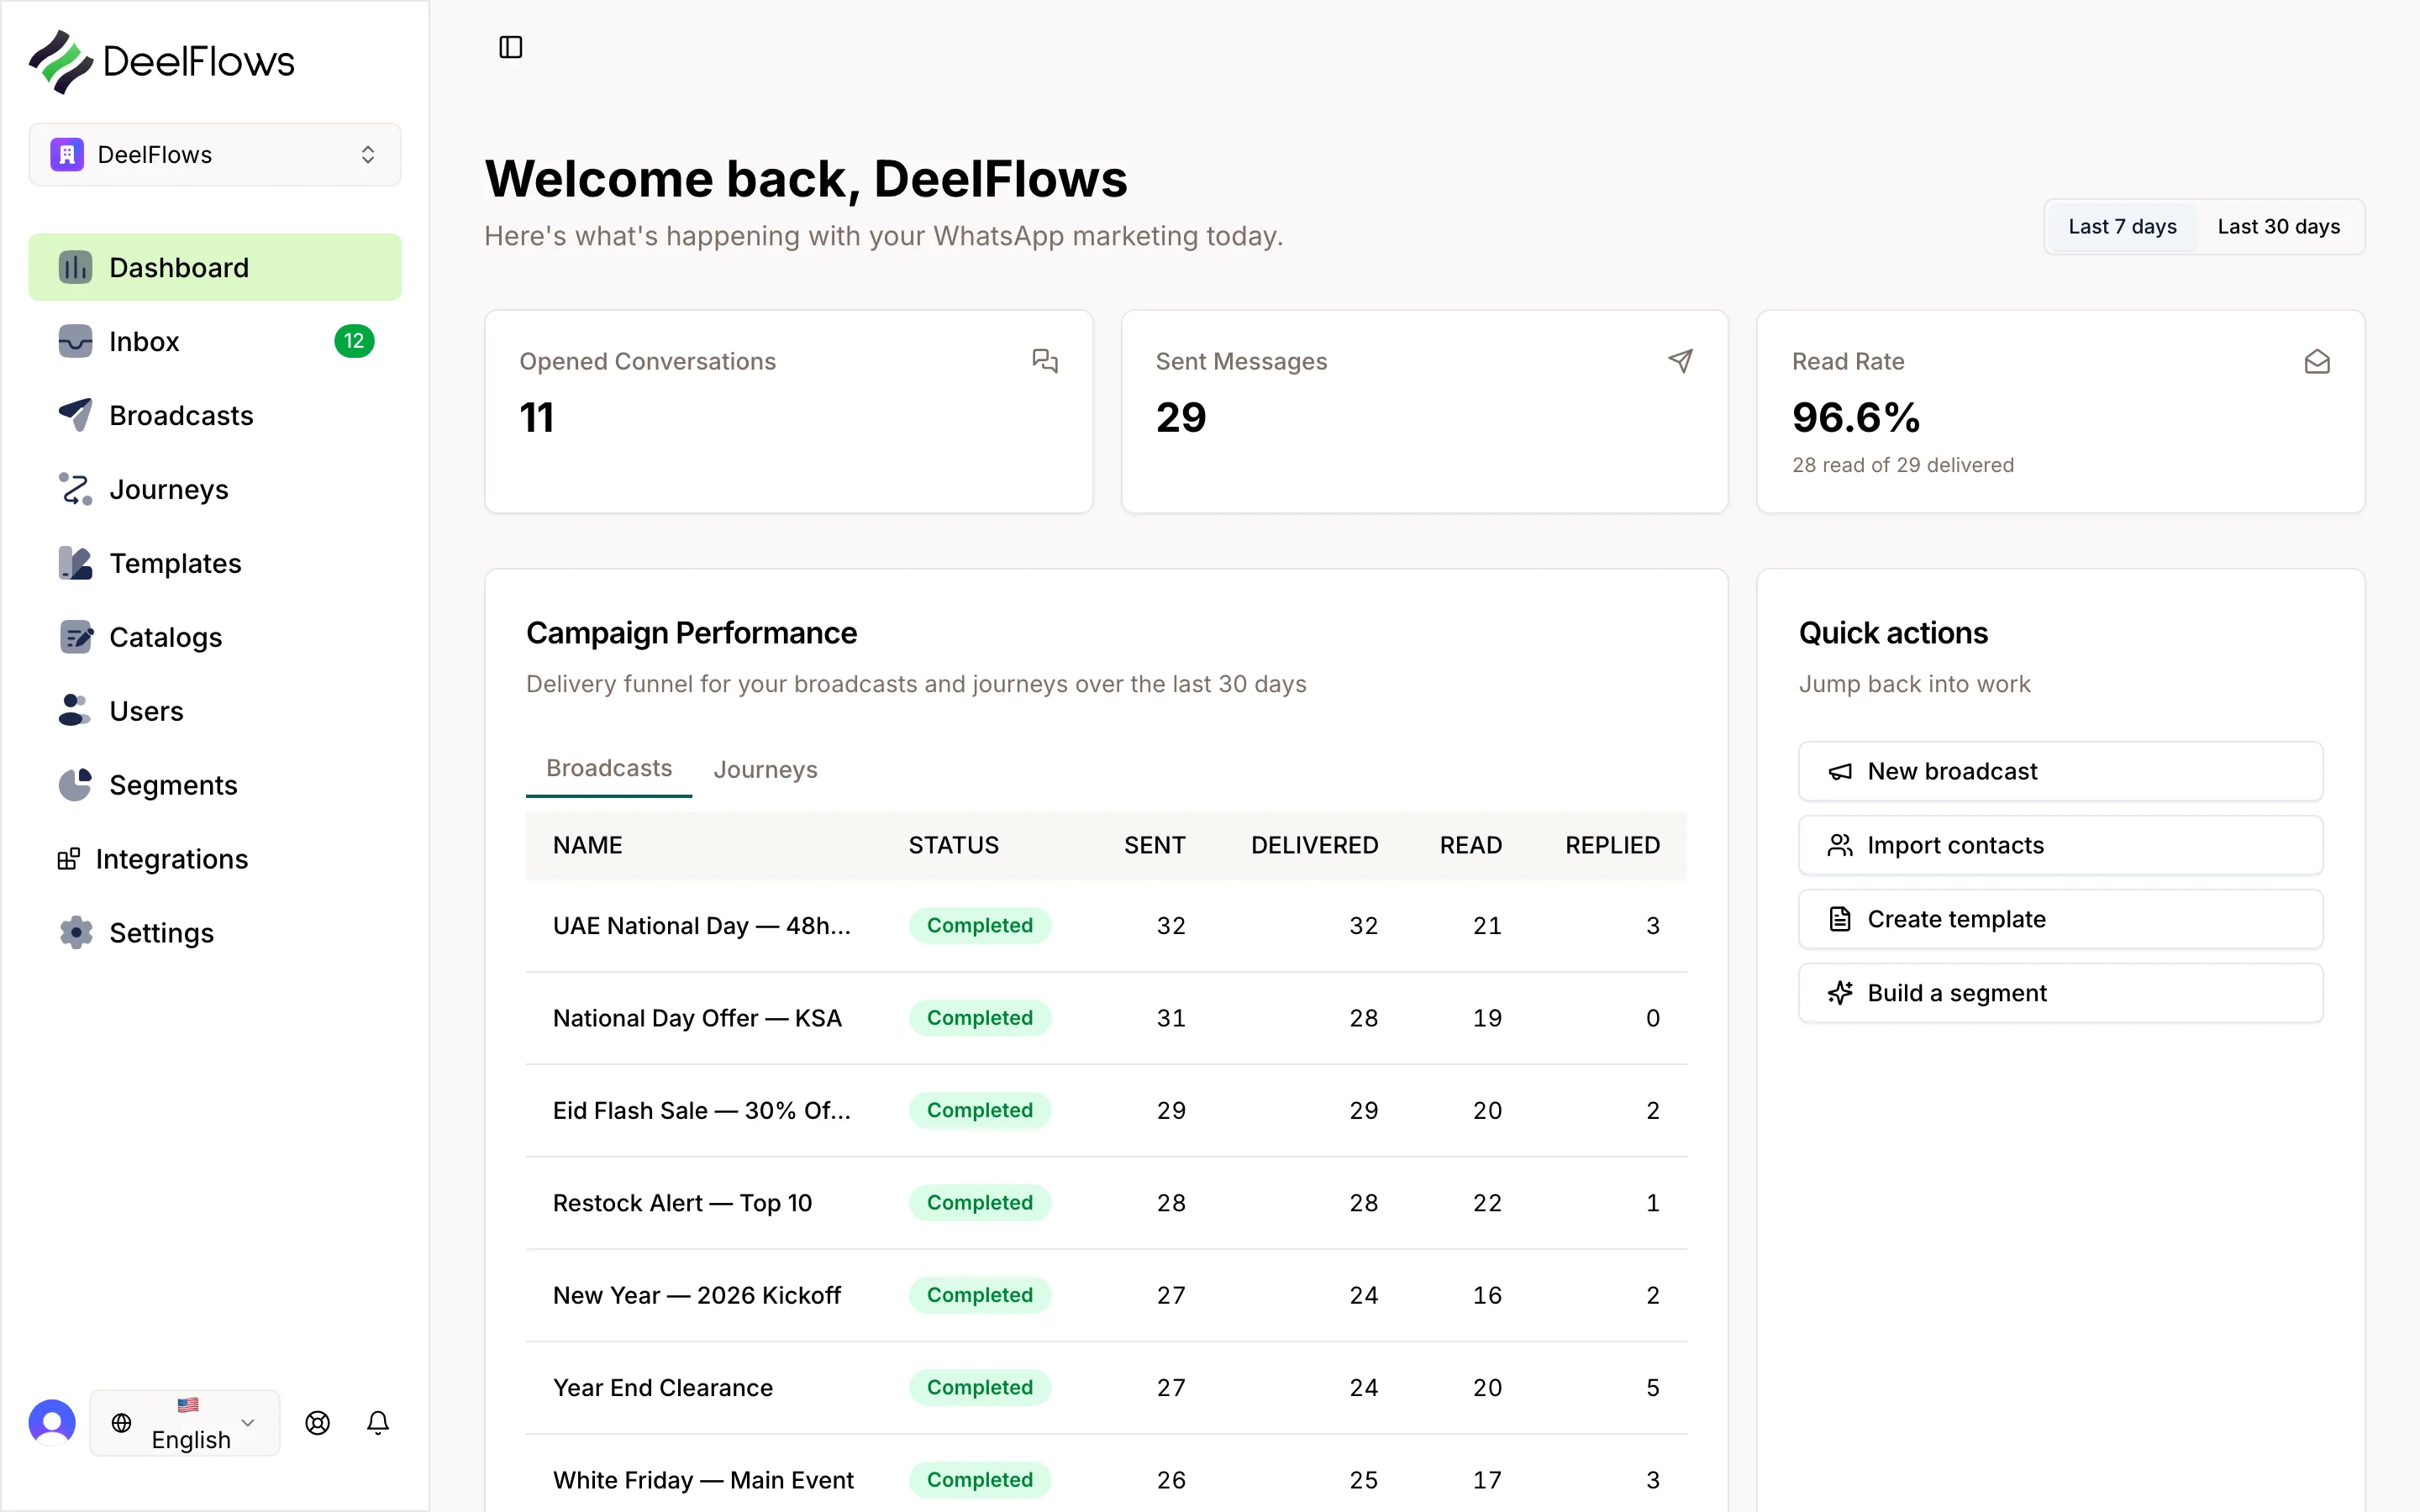
Understand the key metrics and charts on your DeelFlows dashboard.
What it is
The Dashboard is your home page in DeelFlows. It shows you the most important metrics about your WhatsApp marketing performance.
You'll see how many Contacts are opted in, how many messages you've sent, your open and reply rates, and revenue generated from WhatsApp campaigns.
The Dashboard updates in real-time. You can filter by date range to compare performance week-over-week or month-over-month.
When to use it
- You want a quick snapshot of your WhatsApp marketing performance
- You need to report on message volume and engagement rates
- You want to see which Broadcasts and Journeys are driving the most revenue
- You're tracking opt-in growth over time
- You need to monitor your WhatsApp conversation costs and usage
Step by step
1. Open the Dashboard
Click Dashboard in the main navigation. You'll see the overview page with your key metrics.
The default view shows data for the last 30 days. Use the date picker in the top right to change the range.
2. Review Contact metrics
The top row shows total Contacts, opted-in Contacts, and new Contacts added this period.
These numbers tell you how fast your list is growing and what percentage of your list you can message.
If your opted-in count is low, focus on running opt-in campaigns or fixing your consent flow.
3. Check message performance
The Messages Sent card shows how many messages DeelFlows delivered during the selected period.
Below that, you'll see Open Rate (percentage of Contacts who opened the conversation) and Reply Rate (percentage who replied).
Compare these rates to industry benchmarks. WhatsApp typically gets 70-90% open rates and 20-40% reply rates.
4. Track revenue and conversions
The Revenue card shows total revenue attributed to WhatsApp messages. This includes orders placed within 7 days of receiving a message.
The Deals card shows how many Deals were created or won during the period.
Use this to calculate your ROI. Divide revenue by your WhatsApp messaging costs to see if your campaigns are profitable.
5. View top-performing campaigns
Scroll down to see charts for top Broadcasts and top Journeys by revenue or engagement.
Click on any Broadcast or Journey name to see detailed performance metrics.
Use this to identify what's working and replicate successful patterns in future campaigns.
6. Monitor conversation usage
The Conversation Costs card shows your WhatsApp usage and estimated costs for the period.
WhatsApp charges per conversation, not per message. A conversation includes all messages within a 24-hour session window.
If costs are higher than expected, check if you're sending too many duplicate messages or starting unnecessary conversations.
FAQ & gotchas
What does opted-in mean?
Opted-in Contacts have given you permission to send them Marketing messages on WhatsApp. DeelFlows tracks this automatically based on their consent actions like replying to an opt-in message or clicking a consent link.
How is revenue attributed to WhatsApp?
DeelFlows attributes revenue to WhatsApp if a Contact placed an order within 7 days of receiving a message. If multiple messages were sent, revenue is attributed to the most recent one. This is last-touch attribution.
Why is my open rate so low?
Low open rates usually mean Contacts aren't interested or your timing is off. Try segmenting your audience better, personalizing your messages, or sending at different times of day. Also check if many Contacts have blocked your number.
Can I export Dashboard data?
Yes. Click the Export button in the top right to download a CSV with all the metrics shown on the Dashboard. You can use this for reporting or importing into other tools.
Continue learning
Related articles
What is DeelFlows?
Learn how DeelFlows helps you automate WhatsApp marketing and recover abandoned carts.
→Connect Your WhatsApp Business Account
Link your WhatsApp Business Account to DeelFlows in under 5 minutes.
→Invite Team Members
Add Operators to your Workspace so your team can manage Contacts and campaigns together.
→Can't find what you're looking for?
Contact Support